Condensate Removal

Contents
The Stall Chart - Constant Flow Secondary - Constant Inlet Temperature - Varying Outlet Temperature
A simple method of calculating stall is to use a stall chart. This tutorial explains the use of a chart to calculate stall for a constant secondary flowrate with a varying inlet temperature
- Constant Flow Secondary
- Varying Inlet Temperature
- Constant Outlet Temperature
By definition, stall will occur when the steam pressure in the heat exchanger is less than or equal to the condensate backpressure.
Good results are obtained from heat transfer calculations as shown in Module 13.4. Those not wishing to use a mathematical approach can use a simpler method to arrive at a practical result.
This method is graphical and involves the use of a ‘stall chart’. It gives slightly less accurate results, but is perfectly adequate for most practical purposes.
A reduction in heat load is usually due to an increasing inlet temperature or a reducing secondary fluid flowrate, and requires a fall in steam pressure for control to be maintained. Sometimes stall may be caused by a combination of these, or perhaps a fall in outlet temperature due to a change in the set point.
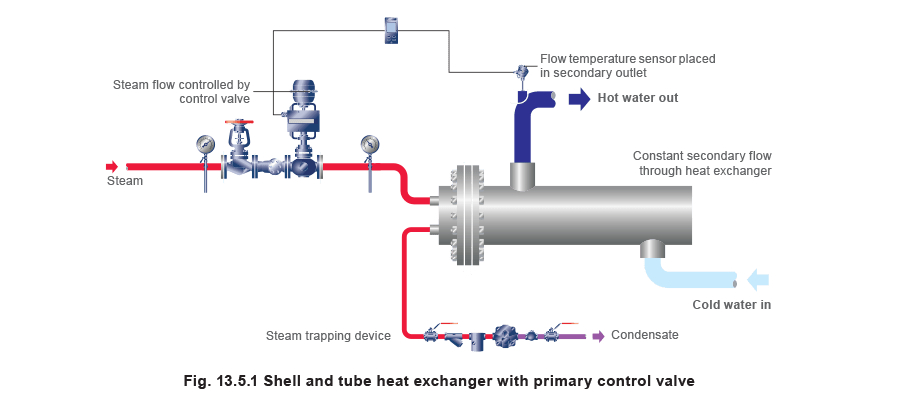
Constant secondary flowrate with varying inlet temperature
In this type of heat exchanger, the secondary flowrate and outlet temperature remain constant while the inlet temperature varies with changes in heat load.
At full-load the inlet temperature will be at its lowest. With a constant secondary flow through the heat exchanger, any reduction in the heat load will cause the inlet temperature to rise. The stall chart can show how the steam temperature and the inlet temperature change as the heat load changes, and predict the inlet temperature at stall and the minimum load condition.
Under full-load conditions, the temperature difference between the steam and secondary fluid will be large. Conversely, under no-load conditions there is no heat exchange so the steam and secondary fluid must be the same temperature, and the temperature difference between them is zero. By proportionality, it follows that at 50% load this temperature difference is 50% of its maximum value.
From this basic principle of proportionality, two straight lines can be drawn onto a chart to represent all these conditions. At full-load the lines are furthest apart, showing that the temperature difference is at a maximum. At no-load the lines converge to a single point, showing that the temperature difference is zero.
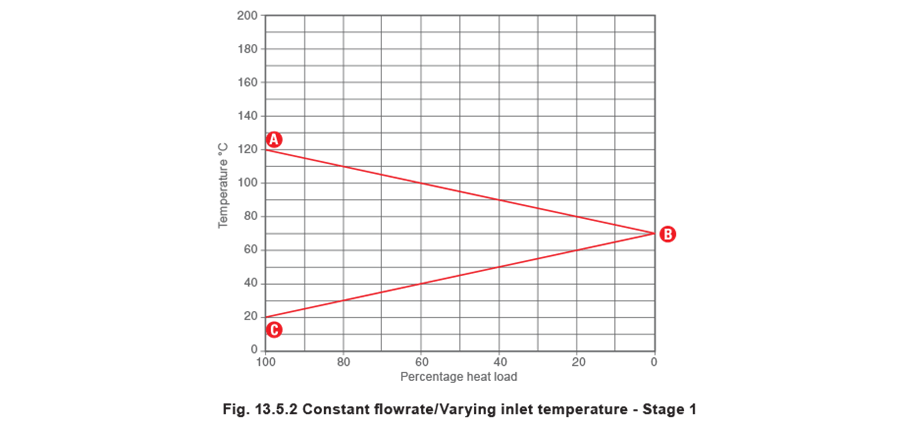
A typical stall chart is shown in Figure 13.5.2. It considers a steam temperature of 120°C heating a constant flow of secondary water from 20°C to 80°C. Note that the steam temperature of 120°C is arrived at by one of two means:
Firstly, the steam temperature in the heat exchanger under full-load conditions (Point A) is marked upon the left vertical axis in the stall chart in Figure 13.5.2. Secondly, the desired secondary fluid outlet temperature is marked on the right vertical axis (Point B). The secondary fluid inlet temperature (Point C) at full-load is then marked on the left vertical axis.
If a straight line then joins the points A and B, the line AB will represent how the steam temperature alters relative to changes in heat load. Similarly, if a straight line joins the points B and C, the line BC will represent the changing inlet temperature of the secondary fluid as the heat load varies.
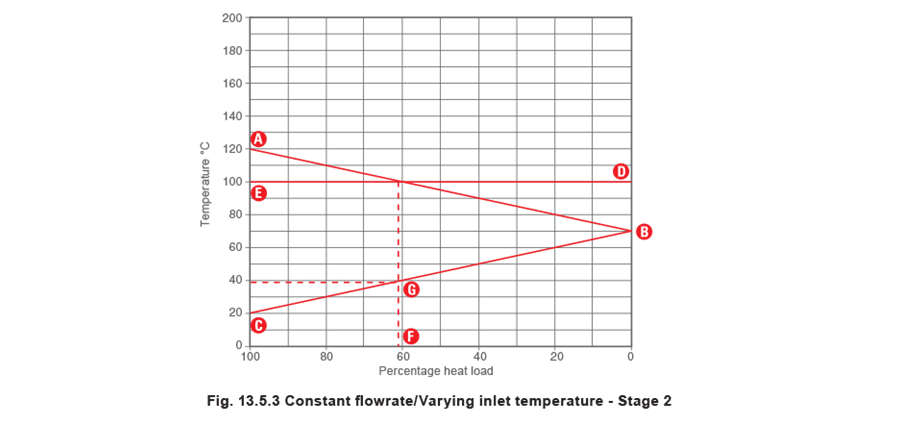
It is then necessary to add a horizontal line to represent the equivalent steam saturation temperature of the condensate backpressure. This temperature should be marked on the right vertical axis, as shown in the Figure 13.5.3 (Point D). A straight line should then be drawn in to connect this point with the same temperature on the left vertical axis at point E.
The condensate backpressure takes into account the pressure in the condensate system plus any static pressure that may be due to a lift in the condensate discharge line from the bottom of the heat exchanger. A column of liquid will exert a pressure at its base due to its own mass. This is often referred to as ‘static lift’ when it is exerted on the outlet of the trap.
A 1 metre column of water under atmospheric pressure will exert a pressure at the bottom of the column of approximately 10 kPa or 0.1 bar g (actually 9.806 65 kPa or 0.098 066 5 bar). Any lift in the condensate discharge line will thus exert a static lift due, to the column of condensate held in the line, in addition to any pressure in the condensate system.
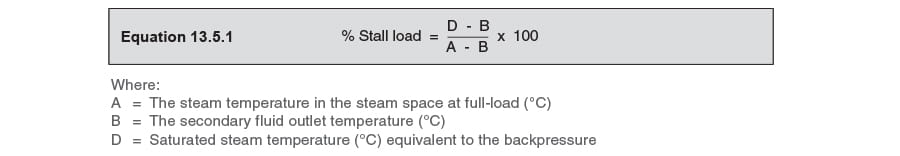
The horizontal line DE will either intersect the line AB, or will be above point A on the chart. The point of intersection between the lines AB and DE represents the ‘stall point’, where the steam pressure and the backpressure are the same. If the line DE is on or above point A, the system permanently operates under stall conditions. (In vacuum condensate systems, or when B is greater than 100°C, point D may also be below point B, if this is the case, the system will not stall at any heat load). A vertical line should then be dropped down from the stall point. The point at which this vertical line crosses the bottom horizontal axis (Point F) marks the percentage stall load relative to the full heat load. The percentage stall load can also be quickly calculated using Equation 13.5.1.
The vertical line connecting the stall point with point F will also intersect the line BC. If a horizontal line is drawn from this intersection point to the left vertical axis, this will mark the secondary inlet temperature at which stall occurs (Point G).
Example 13.5.1
The steam pressure in a heat exchanger at full-load is observed to be 7 bar g. Condensate pressure is 1 bar g, and there is a lift after the trap of 10 m. At full-load, the secondary fluid enters the heat exchanger at 25°C and leaves the heat exchanger at 80°C.
- What is the percentage heat load at stall?
- What is the secondary inlet temperature at stall?
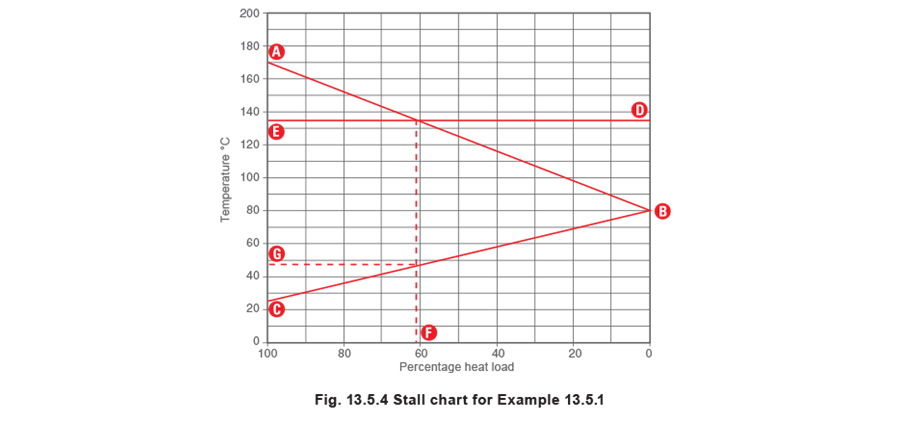
The saturation temperature of saturated steam at 7 bar g is 170°C. Therefore the steam temperature in the heat exchanger at full-load is 170°C. This can then be plotted as point A in Figure 13.5.4:
1. What is the percentage heat load at stall?
The secondary fluid outlet temperature of 80°C should be plotted as point B in Figure 13.5.4, while the secondary fluid inlet temperature at full-load of 25°C should be plotted as point C.
The lift in the condensate line of 10 m creates a backpressure of 1 bar, in addition to the 1 bar g pressure in the condensate system. Therefore, the total system backpressure is 2 bar g. As the saturation temperature of steam at 2 bar g is 135°C, the horizontal line DE representing the backpressure is added at this temperature.
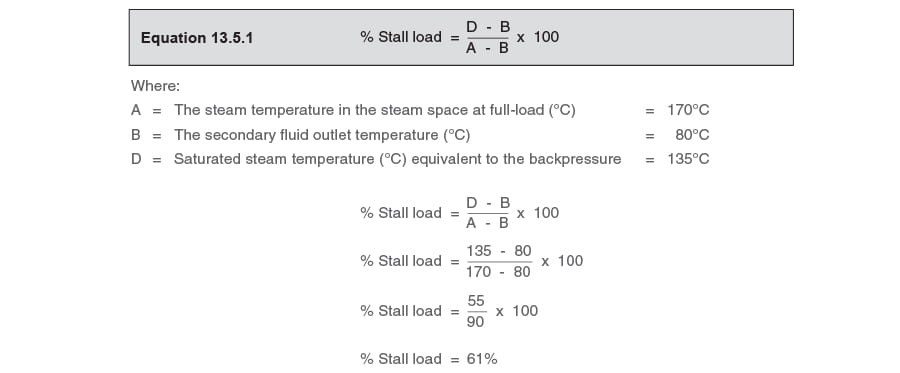
The stall chart in Figure 13.5.4 shows that the percentage heat load at stall (Point F) is approximately 61%. The mathematical calculation can be validated by use of Equation 13.5.1:
2. What is the secondary inlet temperature at stall?
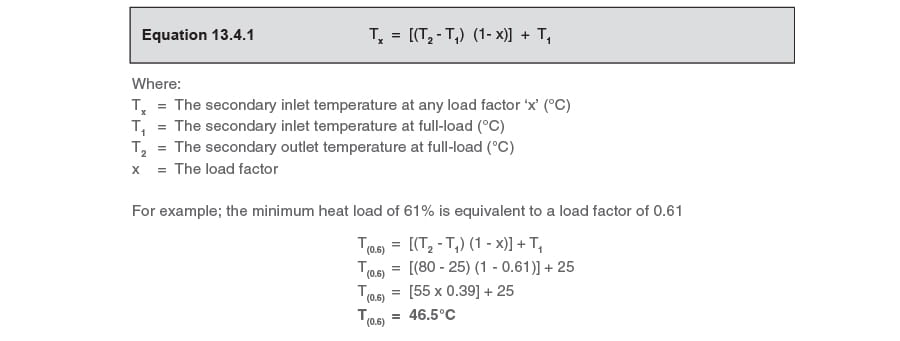
The stall chart in Figure 13.5.4 also indicates that the inlet temperature at stall (Point G) is about 46°C or 47°C. The mathematical calculation can be validated by use of Equation 13.4.1: